"Do our inserts actually work?"
It's the question every marketing budget faces. You're spending money on printed materials, inventory, and fulfillment labor. Leadership wants numbers, not vibes.
The honest answer for most brands: they don't know. They add inserts because it "feels right" or "competitors do it." There's no tracking, no attribution, no proof of ROI.
This guide changes that. You'll learn how to track insert performance with the same rigor you apply to paid ads—so you can optimize what works and cut what doesn't.
Digital marketing has a measurement advantage: clicks are trackable.
Someone clicks your ad → lands on your site → buys something. Clear attribution.
Physical inserts don't have clicks:
The lack of immediate, clickable response led many brands to treat inserts as unmeasurable "brand building." That's wrong.
Inserts are measurable. You just need the right framework.
Definition: Customers who received a specific insert.
How to track: When Insertr adds an insert to an order, it records:
This is your sample size—the denominator for calculating rates.
Definition: Recipients who placed a follow-up order within your attribution window.
How to track: Insertr matches:
A "conversion" means the customer came back and bought again.
Definition: Total revenue from conversion orders.
How to track: Sum of order totals from all attributed conversions.
This is your top-line impact—what the insert program generated.
Definition: What you spend per insert (printing + fulfillment labor).
How to track: You enter this in Insertr when setting up the rule. Typical costs:
This is your investment—the denominator for ROAS.
Definition: How many times a printed discount code was used.
How to track: Insertr tracks:
This gives you hard attribution—someone typed your insert's code.
In Insertr, conversion tracking is configured per rule:
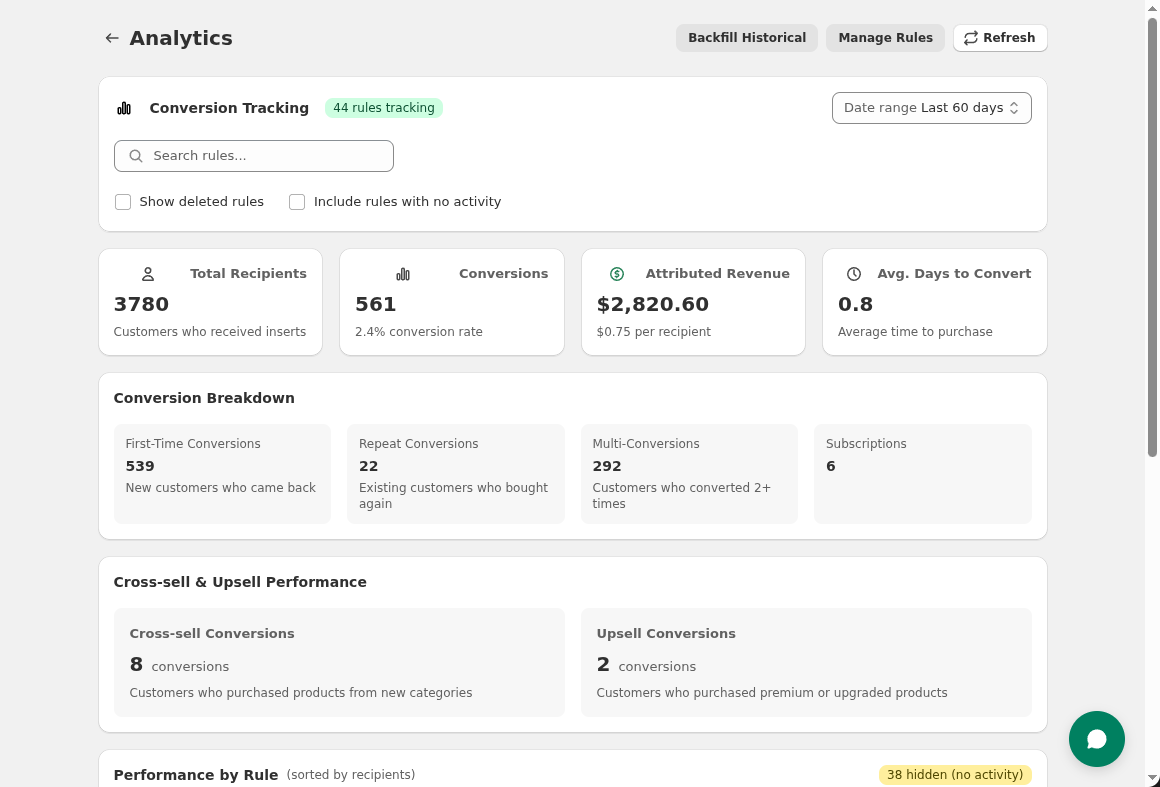 Enable conversion tracking to measure recipients, conversions, and revenue per rule.
The attribution window defines how long after receiving an insert a conversion is counted.
Window too short: Miss delayed conversions (customer used insert 45 days later) Window too long: Attribute conversions that weren't caused by the insert
Recommended windows by product type:
| Product Type | Typical Reorder Cycle | Recommended Window |
|---|---|---|
| Coffee, supplements | 30-45 days | 45-60 days |
| Skincare, beauty | 45-60 days | 60-75 days |
| Apparel | 60-90 days | 90 days |
| High-ticket (furniture, electronics) | 90-180 days | 120 days |
| Subscription upsells | 30 days | 45 days |
Rule of thumb: Set the window to 1.5× your typical reorder cycle.
To calculate ROAS, enter what each insert costs you:
| Cost Component | Example |
|---|---|
| Printing/materials | $0.25 |
| Fulfillment labor | $0.10 |
| Total per insert | $0.35 |
Be honest about costs. Understating makes ROAS look artificially good.
For discount cards: Include the discount value as cost when calculating profitability, but note it's variable (only incurred on redemption).
For inserts with printed discount codes:
THANKYOU15)This gives you:
What it is: Count of customers who received the insert.
What it tells you: Your sample size and reach.
Example: 500 recipients = 500 customers received this insert.
What it is: Number of recipients who placed a follow-up order within the attribution window.
What it tells you: Did the insert drive action?
Example: 50 conversions from 500 recipients.
Formula: Conversions ÷ Recipients × 100
What it tells you: What percentage of recipients came back?
Example: 50 ÷ 500 = 10% conversion rate
Benchmarks:
| Insert Type | Typical Conversion Rate |
|---|---|
| First order thank you | 8-15% |
| Discount card | 12-20% |
| Product sample | 5-12% |
| VIP gift | 15-25% |
What it is: Total order value from conversion orders.
What it tells you: Dollar impact of the insert program.
Example: 50 conversions × $65 AOV = $3,250 revenue
Formula: Revenue ÷ Recipients
What it tells you: Average value generated per insert sent.
Example: $3,250 ÷ 500 = $6.50 per recipient
Formula: Revenue ÷ Conversions
What it tells you: Are insert-driven customers buying more or less than average?
Example: $3,250 ÷ 50 = $65 AOV
Why it matters: If insert-driven AOV is lower (e.g., because of discounts), factor that into ROI calculations.
Formula: Revenue ÷ (Recipients × Insert Cost)
What it tells you: For every $1 spent on inserts, how much revenue returned?
Example:
Benchmarks:
| ROAS | Interpretation |
|---|---|
| < 1× | Losing money |
| 1-3× | Break-even to modest return |
| 3-8× | Solid performance |
| 8×+ | Excellent |
Discount codes give you hard attribution—someone typed the code that was on your insert.
THANKYOU15Scenario 1: 100% recipient redemptions All redemptions are from insert recipients. The insert drove these sales directly.
Scenario 2: Mixed redemptions (70% recipient, 30% non-recipient) 30% of redemptions are from people who didn't receive the insert. This means:
Word of mouth is valuable but attributes differently than direct insert impact.
Scenario 3: High non-recipient redemptions If most redemptions are non-recipients, the code may have leaked (posted online, shared widely). Consider:
Track discount code redemptions and distinguish between recipient and non-recipient usage.
| Approach | Pros | Cons |
|---|---|---|
| Shared code (same code on all inserts) | Easier to set up, easier for customers | Can't track individual attribution, may leak |
| Unique codes (different code per customer) | Precise attribution, prevents leakage | More complex to print, customer may lose their specific code |
For most brands, shared codes are sufficient. Track recipient vs. non-recipient redemptions to understand how much is direct vs. shared.
Once you're tracking, optimize by testing.
| Test | Question Answered |
|---|---|
| Insert vs. no insert | Does having an insert matter at all? |
| Discount vs. thank you | Does incentive beat relationship building? |
| $5 vs. $10 vs. $15 off | What discount level optimizes ROI? |
| Sample A vs. Sample B | Which sample drives more full-size purchases? |
| Card only vs. card + gift | Does adding a gift justify the cost? |
In Insertr:
Example results after 300 orders:
| Variant | Recipients | Conversions | Rate | Revenue | Cost | ROAS |
|---|---|---|---|---|---|---|
| Discount Card | 150 | 27 | 18% | $1,485 | $150* | 9.9× |
| Thank You Card | 150 | 18 | 12% | $1,170 | $75 | 15.6× |
*Discount card cost includes $0.50/card + average discount value ($0.50)
Interpretation:
Decision depends on goals:
Compare variant performance with per-variant conversion rates and ROAS.
Just because one variant has a higher number doesn't mean it's actually better. You need statistical significance.
Insertr calculates significance using 95% confidence intervals:
| Status | What It Means | What to Do |
|---|---|---|
| "Collecting data" | < 30 per variant | Keep waiting |
| "Early results (not significant)" | Trend visible but sample small | Interesting but don't act yet |
| "Significant (95% confidence)" | Real difference | You can act on this |
| "No significant difference" | Too close to call | Either variant is fine |
Don't stop tests early. A 15% vs. 10% difference might look meaningful at 50 recipients but could be noise.
Leadership doesn't want a statistics lesson. They want:
Insert Program Performance: Q1 2026
═════════════════════════════════════════════════════════

Investment:
  2,500 first orders × $0.50/insert = $1,250

Results:
  Recipients:        2,500 (all first orders)
  Conversions:       300 (12% came back)
  Revenue:           $19,500
  ROAS:              15.6×

Comparison:
  Paid acquisition:  $25/customer × 300 = $7,500
  Insert program:    $1,250 for same 300 customers

Bottom line:
  Insert program delivered 300 repeat customers at
  6× lower cost than acquiring new customers.

Recommendation:
  Expand to high-value orders (>$100) with premium insert.
Compare insert ROAS to other channels:
| Channel | Spend | Revenue | ROAS |
|---|---|---|---|
| Inserts | $1,250 | $19,500 | 15.6× |
| Email (post-purchase flows) | $500 | $8,000 | 16× |
| Retargeting ads | $3,000 | $9,000 | 3× |
| Paid acquisition (for context) | $7,500 | $19,500 | 2.6× |
Insight: Inserts and email have similar ROAS but reach different moments. Retargeting is expensive. Inserts compete favorably with most retention channels.
Want more budget for inserts? Show the math:
Current state:
Proposed expansion:
Net impact:
Recommendation: Test VIP gifts at smaller scale before full rollout.
Counting all-time conversions inflates results. A customer who received an insert 6 months ago and came back isn't attributable to the insert.
Fix: Set appropriate attribution windows (45-90 days typically).
Forgetting fulfillment labor, or not counting discount value, understates true cost.
Fix: Include all costs: materials, printing, fulfillment labor, discount value (if applicable).
Comparing first-order thank you performance to subscription milestone performance isn't meaningful—different contexts.
Fix: Compare within segments. A/B test within the same audience.
"We had 50 orders and variant A is winning by 5 percentage points!"
Fix: Wait for significance. 100+ per variant minimum, ideally 200+.
"The insert didn't work so we won't talk about it."
Fix: Negative results are data. Document what didn't work so you don't repeat it.
Track these metrics monthly:
| Metric | January | February | March | Trend |
|---|---|---|---|---|
| Total recipients | 2,500 | 2,700 | 2,900 | +8%/mo |
| Total conversions | 300 | 340 | 380 | +13%/mo |
| Overall conversion rate | 12% | 12.6% | 13.1% | +0.5pts/mo |
| Total revenue | $19,500 | $22,100 | $24,700 | +13%/mo |
| Insert spend | $1,250 | $1,350 | $1,450 | +8%/mo |
| ROAS | 15.6× | 16.4× | 17× | Improving |
Drill down by rule:
| Rule | Recipients | Conv. Rate | ROAS | Action |
|---|---|---|---|---|
| First Order Thank You | 2,000 | 12% | 16× | Keep |
| VIP Gift | 150 | 22% | 8× | Expand |
| Cross-Sell Sample | 300 | 6% | 4× | Optimize |
| Win-Back Discount | 200 | 15% | 12× | Keep |
Rules with low ROAS need optimization or elimination. Rules with high ROAS need expansion.
Unmeasured marketing is hope disguised as strategy. You wouldn't run ads without tracking conversions. Don't run inserts without tracking either.
The tools exist. The framework is straightforward. The only thing missing is setting it up.
Your action plan:
Know what works. Prove it. Do more of it.
Last updated: February 2026 | Author: Tom McGee, Founder of Insertr
About the Author: Tom McGee is the founder of Insertr and a former Senior Software Engineer at both Shopify and ShipBob. He built Insertr's analytics and attribution features specifically to solve the measurement problem he experienced running Cool Steeper Club, where he needed to prove which inserts actually drove subscriber retention.